Today I tried to help to one of our customers and while I preparing my answer I came to a question - may I expect to have some specific compression ratio if I set some JPEG quality value? I made a small study to figure it out.
The study started from the following question - is it possible to find out JPEG dimensions so that the result file would always have the size of 2 MB (probably at least approximately). To answer this question, we need to predict the compression ratio of the JPEG algorithm. The problem is that it varies from image to image and it is also highly depends on JPEG quality parameter. This parameter exists in almost every API which allows producing a JPEG file and as usual it varies in range [0..100].
However the interesting question is how strong the compression ratio is dispersed? Is there some estimate value for each JPEG quality value? Usually all photos on our phones and cameras have more or less similar size (unless we play with output image size settings too much), so the common sense tells us that it makes sense to check it out.
Trying to google an answer
I decided to google a little bit and figure out if anyone already done such research. I have found a Wiki article with a comparsion of different quality settings, however it uses only one image of very small size. I was not sure if it works for a standard photos you expect your users will upload to your site from their cameras and phones.
I have found few more articles but they either compared old good Lena image (the same problem as a JPEG tombstone from the Wiki article) or they use some abstract Compression Levels (no relation to the JpegQuality value). Looks like it is a time to make my own study to find it out.
Powershell + Graphics Mill = answer for any imaging question
Inspired by a recent Fedor's post about using Graphics Mill with Powershell for batch resizing, I decided to try the same approach to make my study.
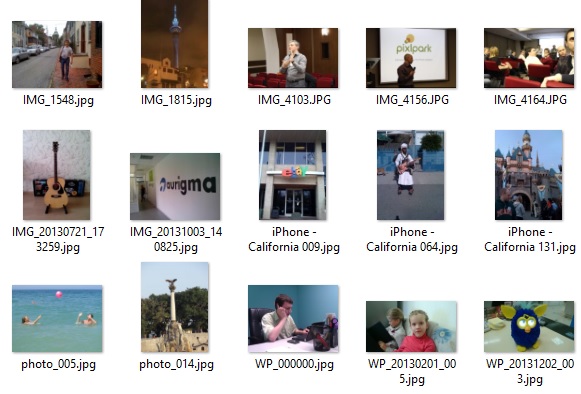
First of all, I picked 60 photos of different sizes and different sources. No fancy or unusual images, just standard photos like everyone makes from time to time to their phones. I know that to have more reliable results it is better to use few hundreds (or even better, thousands) of photos, but I did not want to spend too much time waiting for calculations. If anyone is interested to have more precise data, it is easy to reproduce my experiment.

After that I created a simple PowerShell script. If you are still unfamiliar with it, I recommend to spend 30 minutes to read some tutorials, because it is really interesting and powerful tool.
This script loads all my photos, compresses them to JPEG with different quality values calculates the compression ratio by dividing the size of the uncompressed BMP and JPEG and creates a .csv file with results, so that I could easily process my results in Excel.
I decided to check compression ratios for JPEG values in range [55..100], because lower values are not looking acceptable for the most of the users (too strong artifacts). Also, I decided that the step = 5 will be enough (i.e. values equal to 55, 60, 65, etc).
Here is my script:
[Reflection.Assembly]::LoadFile("C:\Program Files (x86)\Aurigma\Graphics Mill 7 SDK\.Net 3.5\Binaries_x64\Aurigma.GraphicsMill.dll")

$data = @()
Get-ChildItem $PSScriptRoot -Filter *.jpg | `
Foreach-Object{
    Try
    {
        $img = @{}
        $img.Name = $_.Name
        write-host $img.Name

        $memstream = new-object System.IO.MemoryStream

        $reader = [Aurigma.GraphicsMill.Codecs.ImageReader]::Create($_.FullName)
        $bmpwriter = new-object Aurigma.GraphicsMill.Codecs.BmpWriter($memstream)
        [Aurigma.GraphicsMill.Pipeline]::Run($reader + $bmpwriter)

        $img.Dimensions = "" + $reader.Width + "x" + $reader.Height
        $img.Uncompressed = $memstream.Length
        $bmpwriter.Close()
        $memstream.SetLength(0)

        write-host $img.Dimensions
        write-host "uncompressed size: " + $img.Uncompressed

        $jpegwriter = new-object Aurigma.GraphicsMill.Codecs.JpegWriter($memstream)
        $quality = 100
        $step = 5
        do {
            $jpegwriter.Quality = $quality;
            [Aurigma.GraphicsMill.Pipeline]::Run($reader + $jpegwriter)
            $img.("S"+$quality) = $memstream.Length
            $img.("R"+$quality) = $img.Uncompressed / $img.("S"+$quality)
            [Console]::WriteLine( "JpegQuality {0}: ratio={1:0.####} size={2}", $quality,$img.("R"+$quality),$img.("S"+$quality))
            $memstream.SetLength(0)
            $quality -= $step;
        }
        while ($quality -gt 50)

        write-host "Success" -foreground "green"
        $data += New-Object PSObject -Property $img
    }
    Catch
    {
        write-host "Error" -foreground "red"
    }
    Finally
    {
        If ($memstream)
        {
            $memstream.Dispose()
        }
        If ($reader)
        {
            $reader.Close()
            $reader.Dispose()
        }
        If ($jpegwriter)
        {
            $writer.Close()
            $writer.Dispose()
        }
    }
}

$data | Sort-Object | Export-Csv -Path "data.csv" -NoTypeInformation
Just run it in the same folder as your pictures and you will receive a data.csv file which can be opened in Excel.
Note: it requires Graphics Mill to be installed. The trial version will work fine.
Analysis
Here is the most interesting part.
After loading the .csv file into Excel, my first idea was to calculate the average compression ratio for each jpeg quality. Besides of that I have calculated min, max and median values. This way I wanted to know what is the range of dispersion.
It turns out the difference between min and max compression ratio is very large (see a figure below). The smaller JPEG quality you use, the higher this difference may be. So if I need any precise values, I should not rely these estimates at all.
Okay, but let's assume that I don't care about precision and I just want to have some numbers as a rule of the thumb. May I use average?
In theory, if the compression ratio is a normally distributed value, we could use its mean (average) as the most probable value. However when I looked at the median and mean (average), I found out that is not the same. It is a sign that the distribution is not normal.
To approve my observation about the distribution being non-normal, I have also calculated a parameter called skew. The normal distribution should look like a bell and if skew is not 0, it means that this "bell" is a kind of distorted. In my case, skew turned out to be positive (and the value is quite similar for all quality params), which means that the "bell" is skewed to the left. In other words, we should be more pessimistic about the compression ratio (i.e. typically it is smaller than average).

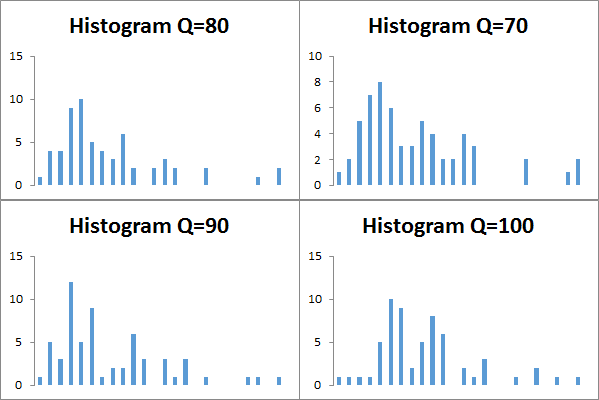
To be 100% sure, I decided to build histograms for each of JPEG quality to look at the distrubution visually. Here what I received (for simplicity, I demonstrate here only 4 histograms, but trust me, all other ones are looking very similar):

So our theory about the skewed bell approved. Moreover, on these histograms we can see that there are several peaks (i.e. there is no a single mode). However I think that if we need some more or less close value of a compression ratio, we can just take the most frequent value of the histogram.
Final result
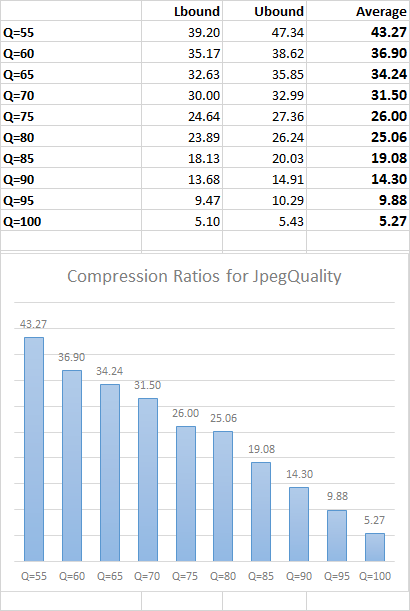
After I came to this idea, I just created a simple table - bin boundaries of the most frequent value for a histogram of a particular JPEG quality and their average as the estimate for its compression ratio.

DISCLAIMER: I am not a big guru in statistics. Also, please keep in mind that this is a rough estimate of the compression ratio you may typically expect, but you should not rely on these numbers the precision is critical for you.