Advanced Tone Correction
As mentioned in the Brightness and Contrast topic, the brightness and contrast correction technique is considered by professionals to be too rough. The problem is that if the brightness and contrast value is too high, it will cause losses in highlights (or shadows for big negative values). To avoid this, more accurate tone correction techniques are used.
For a better understanding let's examine some theory.
Definitions
A bitmap histogram is a special kind of diagram which enables you to estimate the tone features of the bitmap. It is represented as one-dimensional array which contains 256 elements for 8 bit per channel images, and 65355 elements for 16 bits per channel images. Each element of this array contains a number of pixels which have the same intensity value as the index of this element. So the first element of the histogram array contains a number of totally black pixels (with zero intensity), while the 192nd element contains a number of pixels which have the intensity equaling to 191.
The bitmap histogram looks like the figure below:

Using the histogram we can see the tone features of the bitmap. In particular, you can estimate image brightness. For example, if the histogram has a peak in the left part, it means that there is a big number of "dark" pixels, therefore the entire bitmap is dark.
Histograms also enables you to estimate the contrast using the tone range approach. The tone range is an interval on the histogram between the first non-zero elements (or the first elements which are above some threshold) from the left and right sides of the histogram. If the tone range is small (i.e. the difference between the least and the most intensive pixels is small) the contrast is low.
To improve the image brightness or contrast we need to modify the image so the peak of the histogram gets moved to the center or the tone range gets stretched. To accomplish this you should use a special function that changes the original pixel intensity and returns the modified pixel intensity for each pixel and to each channel of the color pixel.
When this function is specified in a tabular form, it is called a look-up table (the abbreviation LUT is often used). In other words, a look-up table is an array wherein each element specifies the value of the function with an argument which is equal to the index of this element.
By the way, the brightness and contrast algorithms may be expressed through such functions. In fact it is just a linear function y = (1 + a)/(1 - a) * x + b , where a is the contrast amount, and b is the brightness amount.
Now it is time to examine how advanced tone correction techniques are implemented in Graphics Mill.
Levels
Level correction is a powerful technique which enables you to transform the histogram, thus the image tone is corrected. Graphics Mill provides two ways of using it:
- Using the ColorAdjustmentProvider.Levels(Single, Single, Single, Single, Single, HistogramMode)
method or using the Levels transform class in a
manual mode (when Levels.Auto is set to
false). - Using the ColorAdjustmentProvider.AutoLevels
method or using the Levels transform class in an
automatic mode (when Levels.Auto is set to
true).
If you choose the automatics correction, the only thing that needs to be explained is the threshold parameter. This parameter defines how the correction will be applied. Its values range from 0 to 1 and define the percentage of pixels at the tonal range edges that will be discarded. The value 1 corresponds to 100%, but if you want to get realistic results, it is recommended to use much smaller values—less than 0.01 (1%). For example, if you want to imitate the result of the AutoLevels function of Photoshop 7, use the value 0.005 (0.5%). And if you want to get results similar to what Photoshop version CS or later produces, use the value 0.001 (0.1%).
The default value of the threshold parameter is 0.001.
The manual mode of level correction needs a bit more thorough explanation.
First, let us take a look at the Levels histogram. Each parameter of the ColorAdjustmentProvider.Levels(Single, Single, Single, Single, Single, HistogramMode) method (and appropriate transform class) matches a triangle slider shown on the following picture with added blue labels for clarity.
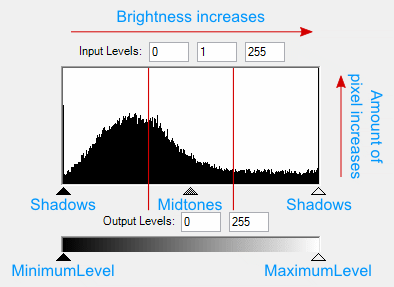
Graphics Mill allows adjusting the histogram that leads to changes in image tones. This means you can program it to adjust shadows, midtones and highlight pixels separately, without affecting each other.
Let's examine the parameters in more detail.
- Shadows - the range of dark pixels. If the shadows slider is moved to the right, we add more pixels to this range. When the pixels between zero luminosity and the shadows value turn black the image loses details in dark tones and the histogram stretches to the left the image gets darker.
- Highlights - the range of light pixels. When adjusting the highlights slider, we add more pixels to this range. Pixels between the highlights value and the maximum image luminosity turn into the lightest color and the image loses details in light tones. As the histogram stretches to the right image brightness increases.
- Midtones - the range of gray pixels. When increasing the midtones value, the histogram is being stretched in the shadows and midtones range, and compressed in highlights. Pixels move from the shadows to midtones making the image brighter. When decreasing the midtones value, pixels move from highlights to the midtones range and make the image darker.
- MinimumLevel, MaximumLevel - the lower and upper bounds of the output tone range respectively. The histogram is scaled proportionally to the output tone range. When increasing the minimum level the histogram is moved to the right and the image becomes brighter. The MinimumLevel value determines the minimum luminosity level for the output image. If the maximum level is decreased the histogram is moved to the left making the image darker. The MaximumLevel value becomes the maximum luminosity level of the output image.
Here is a code example demonstrating how to apply levels correction:
bitmap.ColorAdjustment.Levels(0.03F, 0.9F, 0.05F, 1.5F, 0.7F, HistogramMode.Sum);
The same task using the Levels transform class:
using (var bitmap = new Bitmap(@"Images\in.jpg"))
using (var levels = new Levels())
{
    levels.Auto = false;
    levels.MinimumLevel = 0.03F;
    levels.MaximumLevel = 0.9F;
    levels.Shadows = 0.05F;
    levels.Midtones = 1.5F;
    levels.Highlights = 0.7F;
    levels.HistogramMode = HistogramMode.Sum;
    using (var newbitmap = levels.Apply(bitmap))
        newbitmap.Save(@"Images\Output\out.jpg");
}
This tone correction method also can be run in the automatic mode. However it cannot calculate the parameter automatically. Here is a code example for the automatic levels correction:
bitmap.ColorAdjustment.AutoLevels();
The same example using the Levels transform class:
using (var bitmap = new Bitmap(@"Images\in.jpg"))
using (var levels = new Levels())
{
    levels.Threshold = 0.002F;
    levels.Auto = true;

    using (var newbitmap = levels.Apply(bitmap))
        newbitmap.Save(@"Images\Output\out.jpg");
}
Look-up Tables (LUT)
Graphics Mill enables you to specify the tone correction function in a tabular form. In particular you can define the look-up table (LUT) representing this function. In other words, you can specify your own look-up table and apply it to the bitmap. LUT is an array, each member of which translates luminosity of an input pixel into luminosity of an output pixel.
In Graphics Mill the LUT is represented by the special class named
Lut. A Lut
instance is initialized with a set of points, where the X
coordinate represents the luminosity level of an input image, and the Y - luminosity level of an output image.
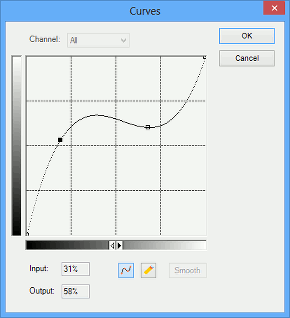
These points determine a curve that forms the LUT. Graphics Mill allows the interpolating of the curve with
cubic and linear interpolation algorithms e.g. the cubic algorithm interpolates points with a spline,
the linear algorithm defines a linearized function. You can also leave the LUT in the form of a discrete function and not apply any interpolation algorithm.
The picture below shows a curve interpolated with the cubic interpolation algorithm that determines the LUT:
To apply a LUT correction, you should just create the Lut class instance, initialize it with setting points using the SetPoint(Point) method, and then pass them to the ApplyLut(Lut) method as a parameter:
using (var bitmap = new Bitmap(@"Images\in.jpg"))
using (var lut = new Lut())
{
    lut.SetPoint(50, 70);
    lut.SetPoint(100, 150);
    lut.InterpolationMode = LutInterpolationMode.Cubic;
    bitmap.ColorAdjustment.ApplyLut(lut);
    bitmap.Save(@"Images\Output\out.jpg");
}
The look-up tables can be used not only for tone corrections, but also for other kinds of effects, e.g. you can create an artistic pasteurization effect by applying a LUT which represents the staircase function.
See Also
Reference
- ColorAdjustmentProvider.Levels(Single, Single, Single, Single, Single, HistogramMode) Method
- Levels Class
- ColorAdjustmentProvider.AutoLevels Overload
- Lut Class
- InterpolationMode Property
- ApplyLut(Lut) Method